Analyzing the Memory Usage of a Vaadin Application
Posted on Dec 17, 2015. Updated on Jan 20, 2019
Does your Vaadin application scale well? As Vaadin holds the UI state of every user on the server-side, the used server memory increases with every active user. So can our Vaadin application deal with an increased amount of users in terms of the used memory? We will find out! In this post I present tools and approaches to investigate the memory footprint of our Vaadin application.

TL;DR
- If you ignore the memory that can be garbage collected, the memory usage per Vaadin session is unexpectedly low (~0,1 MB per session in our application).
- The used memory for the server-side UI in our application was as big as expected (8 MB per user in our application). However, the garbage collection does a really good job and can release the large part of the allocated memory. But this means more CPU utilization. Also keep in mind that the used memory depends on the way your components and containers hold and access database entries (lazy, eager, paging etc.). Besides, it’s important to make the views and containers be eligible for GC.
- XRebel provided us an extremely useful insight into the memory utilization (and much more) of our application. This helped us to understand our application better.
- The JMX Console of Java Mission Control (JMC) has been used to monitor the memory usage of our application.
- Somehow our Gatling and JMeter test didn’t worked. So we used Selenium to simulate several users using our application. We logged the current heap size after every login of a simulated user. Besides, we ran the Garbage Collection so we only track the memory which is absolutely necessary.
- Although relevant for scalability, I don’t cover the following points in this post: CPU usage, network traffic, running real load tests, trying to scale our Vaadin application horizontally. These issues are subjects for further investigations.
Motivation
“Vaadin doesn’t scale, because it holds the UI state on the server-side.” Sounds reasonable, doesn’t it? I claim, that this scalability argument is used to often and especially in cases where Vaadin could still deal with the load. It would be very pity, if we switched to another framework and lose the great development experience and productivity and eventually have to state that we underestimated the ability of Vaadin to deal with the load.
In a past project of mine, we were facing an upcoming increased amount of users (from 2-3 concurrent users up to 100 concurrent users). I wanted to find out, if our existing Vaadin application can still handle this load. So I decided to investigate the memory usage of our application.
Although I focus on Vaadin-based applications, the presented tools and approaches can also be used to analyze every Java-based web application (for instance JSF or an angular.js-REST-application). They are independent from the used framework.
Using XRebel to Investigate the Memory Usage of a User’s Vaadin Session
I started my investigation with a look at the Vaadin session of a single user. For this purpose I used XRebel, which is a great tool for profiling a Java-based web application. It is directly visible in the application and provides useful live information. XRebel shows, for instance, which HTTP requests leads to which database queries (with the real values, not the placeholder “?”) and how long they took. Moreover, it shows the content of the HTTP session and its contents. That’s what I was looking for!
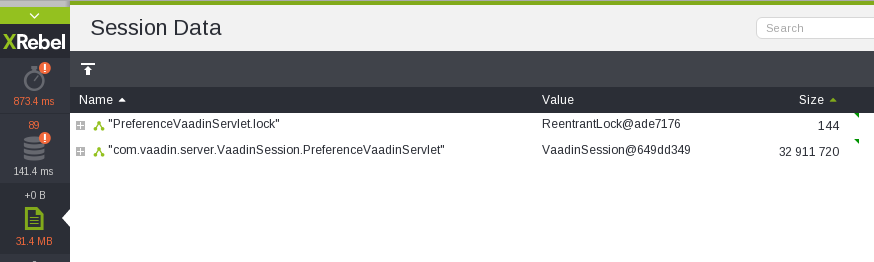
XRebel reveals the size and structure of the user’s session.
Look at this! A Vaadin session of a single user is 33 MB big? That’s huge and way too much. This will never ever scale! But before giving up, let’s drill down into the session’s structure (using the “+”-symbol). Maybe we can find the cause for this size.

UI inside the session
OK, the UI state within the session is the culprit. Let’s continue. After drilling a little bit deeper into the UI layouts and components I discovered a field of a layout:

The cause for the huge session size: A Guice Provider
The field “changeContextProvider” is a Guice Provider. Please note the reference ID “@449488f7”. I have no idea, why this class is so big. But before I analyze this issue, I have opened a second tab of the current view in my browser. I had expected another UI in the session with 32 MB. But surprise surprise:

The other UI is much smaller than the first one.
The new UI is way smaller than the first one (19 KB instead of 32 MB). That’s interesting! I´ve searched for the “changeContextProvider”:

The other UI contains just a reference.
The other UI contains a reference to the provider. Note the same reference ID (“@449488f7”). The provider seems to be shared. Ok, let’s open a new session as a new user and take a look at the field:
All sessions of all users share the same provider.
The same reference ID, although it’s another session! The provider is an application-wide singleton and is shared between all sessions. This means, that the huge provider is not relevant for scaling. Moreover, I discovered other Guice providers that are also shared between all sessions. So I assumed that the effective size of a session is way smaller than it is shown in XRebel. Next, I wanted to verify this assumption.
Execute a Simple Selenium Test and Monitor the Heap Size
Then I have analyzed the memory footprint of the whole application while I simulated a couple of users using the application.
I have tried Gatling and JMeter for writing some real load tests and followed the instructions for writing Gatling test in Vaadin and JMeter tests in Vaadin. But unfortunately my application had logged nothing during the tests, although it should have. So I conclude the server-side has not been triggered correctly. However, I highly recommend to try these tools and write some real load tests before you go with my approach.
Setup
I use the JMX Console of the Java Mission Control to monitor the heap size of the JVM. You can open the console by right clicking on the process and select “Open JMX Console”. JMC is shipped with our JDK and is located in <jdk>/bin/jmc.
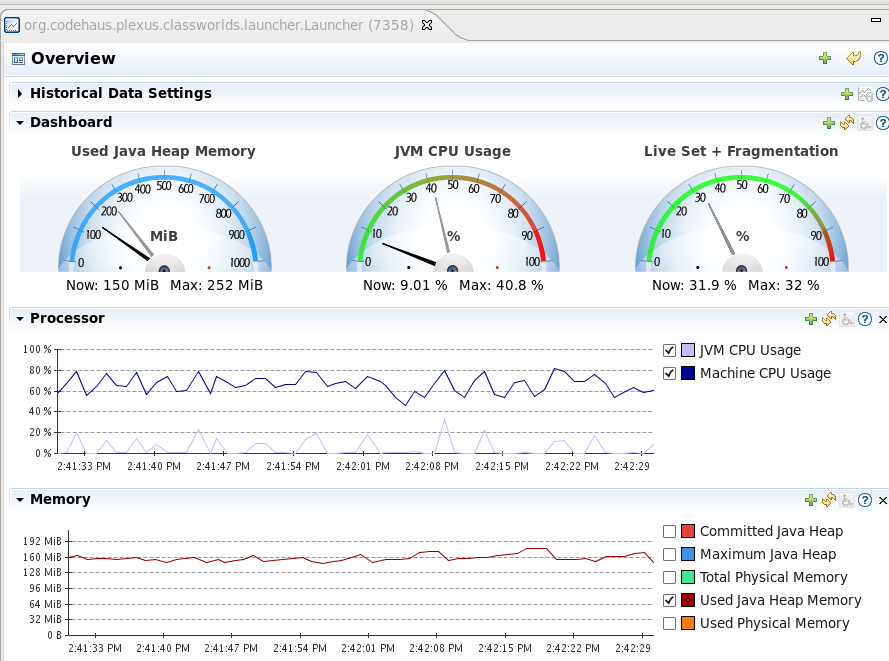
The JMX Console of Java Mission Control
I wrote a little Selenium test that opens the login page, enters the credentials and get redirected to the application. This workflow is repeated in a loop.
@Category(FrontendTest.class)
public class SessionFootprintTest extends VaadinTest {/* Our base class for Vaadin tests, considers the async processing. */

    @Test
    public void loginAndEnterApp() throws IOException {
        callGcAndPrintHeapUtilization(0);
        for (int userNo = 1; userNo < 20; userNo++) {
            login("user", "password");
            callGcAndPrintHeapUtilization(userNo);
        }
    }

    private void callGcAndPrintHeapUtilization(int userNo) throws IOException {
        URL url = new URL("http://localhost:8182/vpay/CallGcAndPrintMemoryUsage?userNo=" + userNo);
        HttpURLConnection con = (HttpURLConnection) url.openConnection();
        con.getResponseCode();
    }
}
Moreover, I started multiple instances of this test in parallel. This was done with a simple shell script.
#!/bin/bash
max=5
a=1
while [ $a -le $max ]
do
    echo "Starting Test No. $a/$max..."
    mvn failsafe:integration-test -Dit.test=SessionFootprintTest --quiet &
    sleep 2
    a=`expr $a + 1`
done
echo "Started all tests"
Writing Selenium tests for Vaadin out-of-the-box is difficult due to the asynchronous nature of Vaadin. Selenium doesn’t know how long it has to wait after a button click, because there is no page load. It has to wait for the client-side engine to finish the processing of the current asynchronous request. Vaadin offers the commercial tool TestBench for this purpose. There is a trail version available or you can try to write this functionality by your own.
Moreover, I wanted to log the current heap size and optionally trigger the Garbage Collection. Therefore, I wrote a simple Servlet for this job, which is also deployed in the servlet container. The test sends an HTTP request to this Servlet after every login (see snippet given above).
public class CallGcAndPrintMemoryUsageServlet extends HttpServlet {

    final static int MB = 1024 * 1024;
    final Runtime runtime = Runtime.getRuntime();

    @Override
    protected void doGet(HttpServletRequest req, HttpServletResponse resp) throws ServletException, IOException {
        runtime.gc();
        printMemory();
        resp.setStatus(200);
    }

    private void printMemory() {
        System.out.println("used memory: " + (runtime.totalMemory() - runtime.freeMemory()) / MB + " MB");
    }
}
Results
Test Without Running the GC Manually
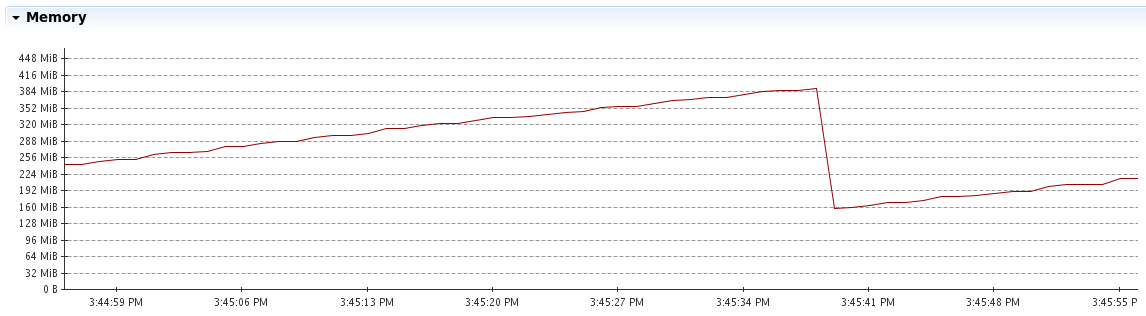
Memory utilization during the test when we don’t call the GC and it runs automatically.
The output:
used memory: 156 MB
used memory: 163 MB
used memory: 173 MB
used memory: 183 MB
used memory: 190 MB
used memory: 198 MB
used memory: 206 MB
used memory: 213 MB
used memory: 221 MB
used memory: 229 MB
used memory: 237 MB
//...
used memory: 376 MB
used memory: 384 MB
used memory: 159 MB //<= GC has ran!
used memory: 164 MB
//...
Moreover, let’s consider also the CPU usage to see if the GC is expensive. Please mind that only the bright blue line (JVM CPU Usage) is relevant.
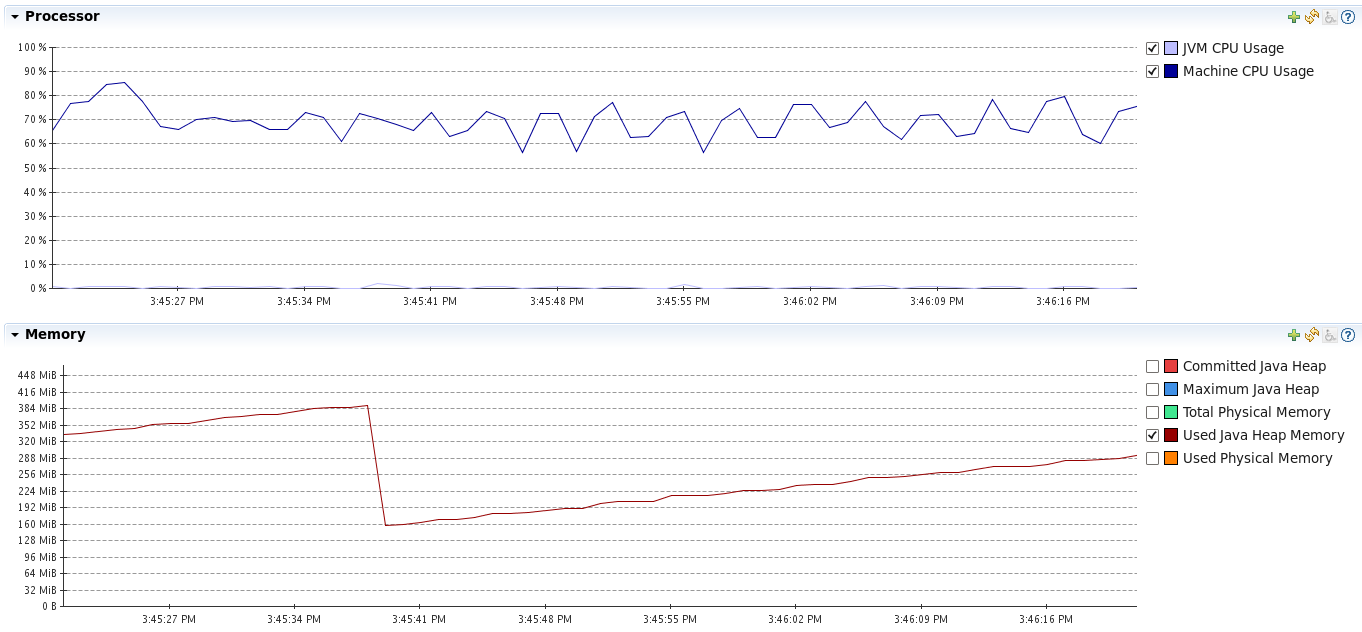
There is only a small peak when the GC runs
- The memory footprint of the application grows constantly with every user that logs in and enters the application (~8 MB for each user).
- However, the memory usage is decreasing dramatically down to < 160 MB every time the GC runs. This means, that there is a lot of memory that is eligible for GC.
- The GC doesn’t utilize much CPU in our load test. However, this is not representative.
- There can be so much memory released, because the components and containers are created every time the user enters a view. These objects aren’t held in the session.
Running the GC regularly
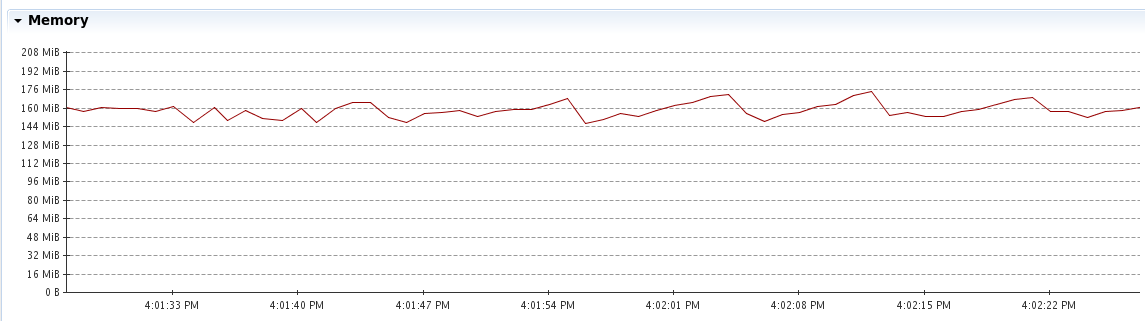
Memory usage during the test when we call the GC regularly
The output (mind that the GC has been called before the output):
used memory: 132 MB
used memory: 149 MB
used memory: 145 MB
used memory: 145 MB
used memory: 144 MB
used memory: 142 MB
used memory: 144 MB
used memory: 144 MB
used memory: 144 MB
used memory: 145 MB
used memory: 145 MB
used memory: 144 MB
used memory: 144 MB
used memory: 144 MB
used memory: 145 MB
...
used memory: 146 MB
used memory: 146 MB
used memory: 148 MB
used memory: 143 MB
- The memory usage is surprisingly constant and grows only very slowly – nearly not noticeably.
- The CPU usage has been higher and with more peak, because we call the GC very frequently. As this is not a realistic situation, we can ignore this behavior.
- So the fixed memory footprint (the parts that can’t be garbage collected) of a user session is very small (~ 0.1 MB). That are good news for the scalability of our application!
Findings
- We will stick to Vaadin as our framework of choice.
- Our Vaadin application will be able to handle more concurrent users with regard to the memory utilization.
- We need to reduce the timeout of the Vaadin session to make the sessions earlier eligible for GC. We will consider the average usage time to determine a proper timeout.
- The views and containers of our application are re-created every time a user opens a view. This way they can be garbage collected, which saves a lot of memory. We could verify this with our simple Selenium test.
- If one instance of the application is not enough (which is very unlikely), we can still horizontally scale the application. We should use sticky sessions in this case.
What’s next?
Scaling is a demanding topic. In this post I focused on some fundamental considerations of the memory footprint and some useful tools. However, there is much more to do:
- We should run real load tests and simulate a high load (e.g. using Gatling or JMeter). This is extremely important to assess the scalability of our application.
- Considering the memory footprint is not enough in order to make a reliable statement about the behavior of our application under load. We also have to take the CPU and network usage into account. The CPU can be especially relevant, because the Garbage Collection has to run more frequently if the number of users increases. But in our simple test we couldn’t see a remarkable CPU usage caused by the GC. Again, real load tests are necessary.
- But even if one instance of our Vaadin application is not enough to handle the load, we can still try to scale our Vaadin application horizontally.
References
- Optimizing Vaadin apps with XRebel (Video).
- Vaadin provides some really useful tips about scaling Vaadin applications. See Scalability and Scalable web applications.
- Vaadin Scalability Study.